Employment Statistics
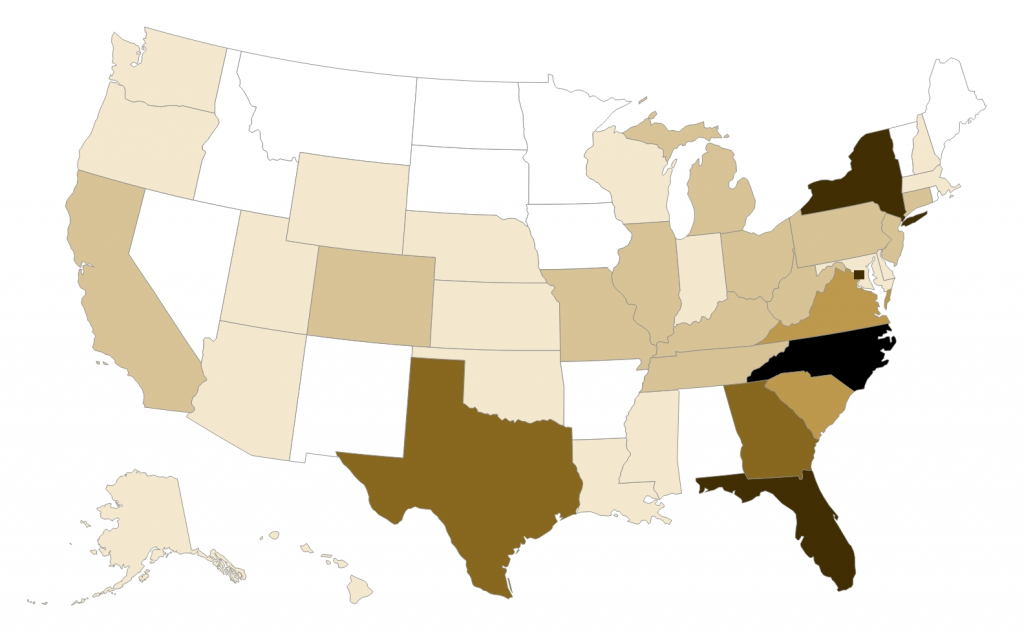
This map shows where Wake Forest University School of Law graduates were employed (class of 2018-2023) ten months after graduation.
Additionally, graduates from these classes were employed internationally as follows: 7 in China, 1 in Japan, 1 in Switzerland, and 1 in the United Kingdom.
To view employment statistics for a particular class year, please choose from the lists to the left of this page under Employment Data.